Transmission Line Details |
|---|
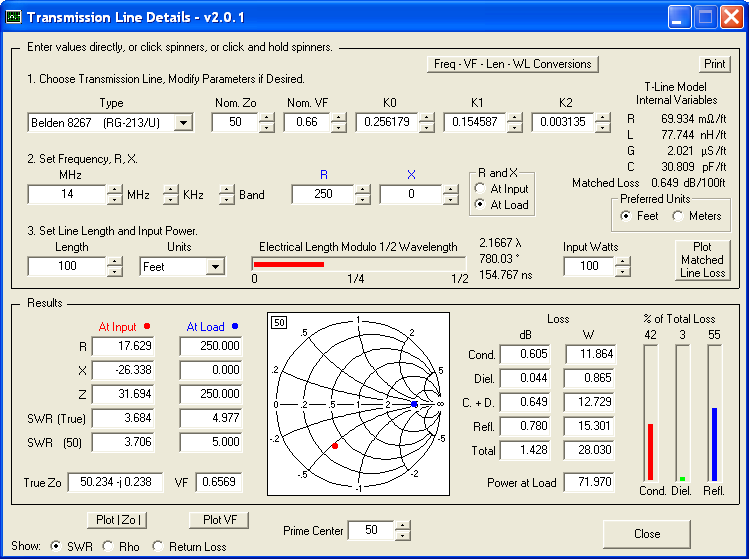
This utility program shows the impedance and reflection coefficient parameters (SWR, reflection coefficient magnitude Rho, or Return Loss RL in dB) at both ends of a transmission line and the details of power loss in the line. It includes built-in specifications for approximately 100 different line types. You can modify the specs to see how small changes affect the results or to specify custom lines. All program inputs may be changed directly or you can use spin buttons to make the changes.
TLDetails includes a plot function that allows you to plot the matched line loss, the true velocity factor, or the true characteristic impedance magnitude, over a frequency range of either 0.1 to 100 MHz or 1 to 1000 MHz. You can experiment with changes to the line parameters (Nominal Zo, Nominal VF, loss coefficients K0/K1/K2) to see how the plots change at various frequencies. You can also compare one line with another by clicking the "Compare" button to freeze one trace and then selecting a different line type from the drop-down list.
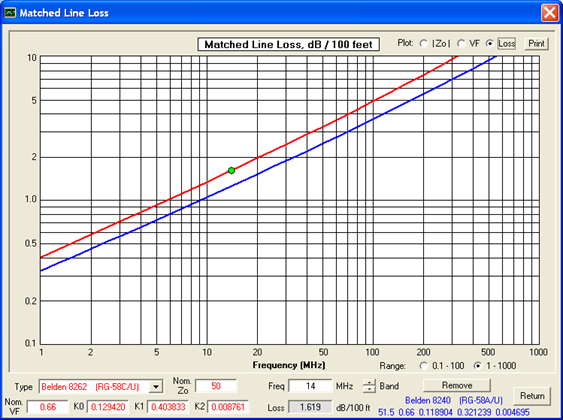
The screen capture above (reduced size) shows the matched line loss comparison for two different types of Belden RG-58 coax. The fact that the matched line loss differs is reflected in the fact that the K0/K1/K2 loss coefficients have different values. (K0 is associated with the DC resistance of the conductors which is a constant for any given line type. K1 is associated with the "skin effect" or "high frequency" resistance of the conductors which varies in proportion to the square root of frequency. K2 is associated with the dielectric loss which varies directly with frequency.)
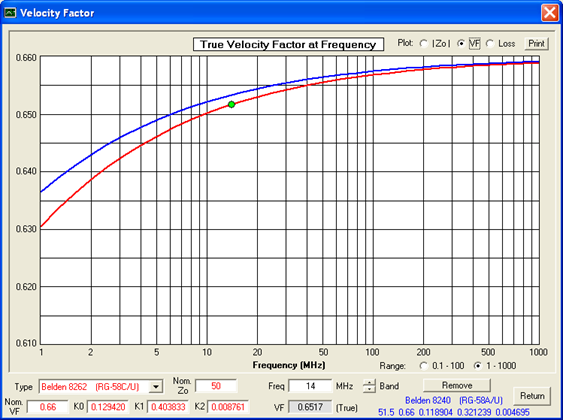
This shows the significant amount by which the velocity factor changes at lower frequencies for the same two RG-58 lines. The change is caused by the internal inductance (inductance within the conductors), which becomes a larger percentage of the total inductance at low frequencies. Note that VF approaches the "nominal" value of 0.66 only at very high frequencies. If the effect of internal inductance had been ignored, as was the case for previous versions of TLDetails, the VF trace would be flat (or nearly so) across the entire frequency range.
This is a plot of the total inductance (internal plus external) for Belden 8262 RG-58, extended by two more decades on the low frequency end. At 0.01 MHz (10 KHz) the internal inductance of approximately 0.023 ÁH/ft makes up about 23% of the total inductance. By contrast, at 1000 MHz the internal inductance has fallen to almost zero and the total inductance has leveled off at its "high frequency" value of 0.077 ÁH/ft, which matches the specification on the Belden data sheet for this particular cable.
Finally, here is a plot of the resistance for Belden 8262 RG-58 with a log Y scale. At high frequencies the resistance changes in proportion to the square root of the frequency; that is, one decade of resistance change for every two decades of frequency change. But at very low frequencies the resistance levels off at the DC value. For this particular cable that value is 14.9 ohms/1000ft, which again matches the specification on the Belden data sheet when the DC resistance of the center conductor and the DC resistance of the outer shield are added together.
Note that for line types with higher loss the resistance curve will level off at both a higher value and at a higher frequency. The inclusion of DC resistance in the TLDetails mathematical model is why you'll see the matched line loss curve "flatten out" at low frequencies for some cables.
Download:
Download TLDetails.zip. Free. Runs as a stand-alone Visual Basic program, does not require Excel.
Important: If you see an error message about "MSVBVM60.DLL" you will also have to download the complete Visual Basic runtime library. This is a large file so I don't keep a copy on this site. You can get it directly from the Microsoft site. Alternatively you can download any one of the thousands of other applications that also use the Visual Basic runtime library, such as the free EZNEC Pro+ v. 7.0 program.
Norton Anti-Virus users: You may see a warning concerning WS.Reputation.1 and/or Download Insight. This is not a virus detection. You can restore the download file from quarantine if necessary and then manually scan it to assure yourself that it is virus-free. For additional information and instructions please see here. If you would rather wade through Norton's corporate response, complete with the latest boardroom buzzwords such as "the wisdom of crowds" and "cloud-based intelligence" see here or here. And if you are curious as to why this is so frustrating for small software developers such as myself please see this article by a small company with whom I have personally done business.
Change history:
- Version 2.0.1, uploaded 28 November 2014.
- Smith chart gridline labels did not display correctly with large fonts.
- Version 2.0, uploaded 10 March 2011.
- Much more accurate mathematical model for transmission lines. The model includes the effects of DC resistance and internal inductance (due to magnetic fields within the conductors) as well as the usual skin effect resistance and external inductance (due to magnetic fields between the conductors) when doing the calculations.
- Plot function added for true Zo magnitude and true velocity factor across frequency ranges.
- Calculate and display distributed RLGC transmission line parameters.
- Calculate and display one-way time delay.
- Added several dozen more built-in line types. Updated specs for all line types to match current data from manufacturers' web sites as of late 2010.
- Remove dependency on the FM20.DLL file. TLDetails is now just like any other stand-alone Visual Basic application.
- Version 1.1, uploaded 20 January 2007.
- Slight change to the way that the characteristic impedance Zo is calculated.
- Version 1.0, initial release, 10 June 2002.