|
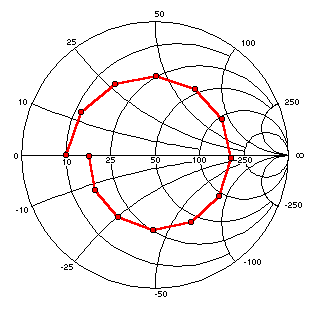
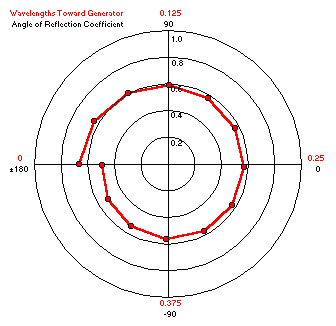
This plot shows both rho magnitude and rho angle at points along a ½ wavelength section of RG-174
at 3.75 MHz. The line is terminated with a load of 10+j0 ohms.
Calculations have been made every 15 electrical degrees working
clockwise toward the generator end of the line.
Rho magnitude is indicated by the distance out from the center of the chart and rho
angle is measured from the 3 o'clock position.
Because RG-174 is a lossy line the plot is in the shape of a spiral rather than a circle.
The reflection coefficient magnitude drops noticeably as the distance from the load is increased.
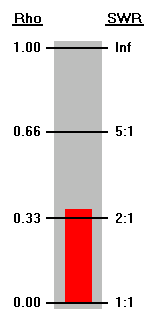
Rho magnitude at the load is 0.667 (SWR 5:1) while after ½ wavelength it has dropped to 0.494 (SWR 2.95:1).
The rho angle starts at (approximately) 180° and sweeps through an entire circle to end up back
at (approximately) 180°.
(Why approximately?)
|
|
|
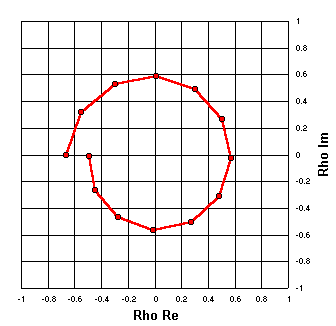
The complex quantity rho can be expressed as real and imaginary components instead of as magnitude and angle.
The scale markings on the plot at left indicate this, but notice that the shape of the spiral is exactly the
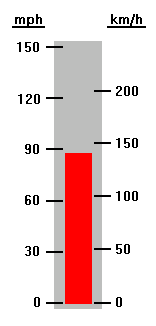
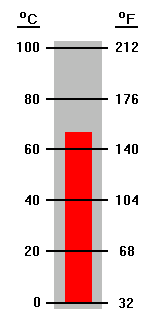
same as with the previous plot. This is analogous to the speedometer and thermometer examples, where the same quantity
may be shown with different scales.
Speed and temperature are of course scalar quantities that can be expressed
with a single number. Rho is a vector quantity that requires two numbers in order to be completely defined.
Trying to put both sets of scales on the same chart would be confusing, but the idea is the same.
|
|
|
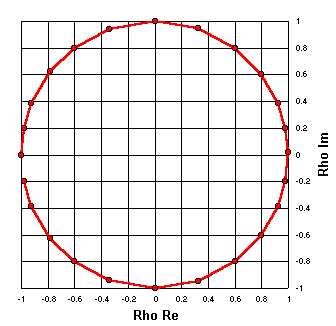
R = 0
Instead of plotting reflection coefficients as would be found along a transmission line we can plot
the reflection coefficients that correspond to arbitrary impedance values.
For any arbitrary complex impedance Z (R±jX) the reflection coefficient may be calculated as
Rho = (Z - Zref) / (Z + Zref)
In this plot all the arbitrary Z values have a resistance of R = 0 ohms.
The reactance values are X = 0, 5, 10, 17, 25, 35, 50, 70, 100, 150, 250, 500, 5000,
-500, -250, ... , -10, and -5.
(That is, Z = 0+j0, 0+j5, 0+j10, etc.)
A reference impedance (Zref) of exactly 50+j0 ohms
has been used for this chart and for all other charts on this page.
|
|
|
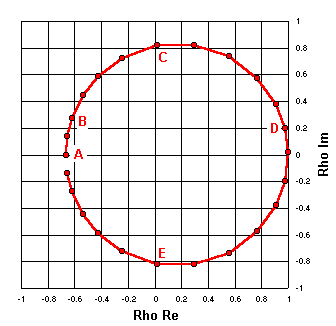
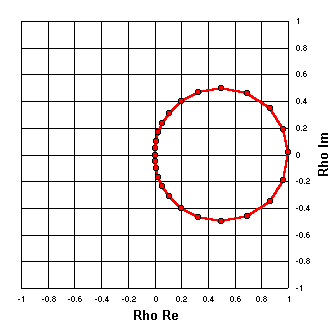
R = 10
Now this process will be repeated, but this time the R component of the arbitrary Z points will be 10 ohms.
The following table shows a few of the calculations.
| Label | Arbitrary Z | Rho Re | Rho Im |
| A | 10 +j 0 | -0.667 | 0 |
| B | 10 +j 10 | -0.622 | +0.270 |
| C | 10 +j 50 | +0.016 | +0.820 |
| D | 10 +j 500 | +0.976 | +0.197 |
| E | 10 -j 50 | +0.016 | -0.820 |
| Rho Zref = 50 +j 0 |
|
|
|
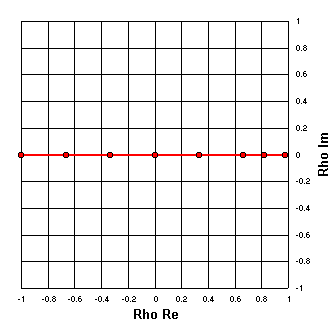
R = 50
And again, but with R equal to 50 ohms.
(Z = 50+j0, 50+j5, 50+j10, etc.)
|
|
|
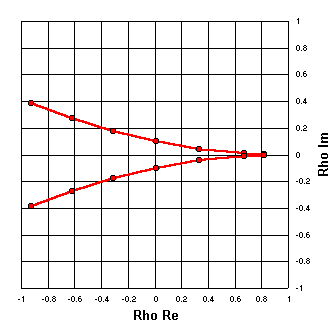
X = 0
Now let's plot the real and imaginary components of the reflection coefficients
from a set of arbitrary Z values with the X component held constant.
In this case R = 0, 10, 25, 50, 100, 250, 500, 5000 and X is held constant at 0.
|
|
|
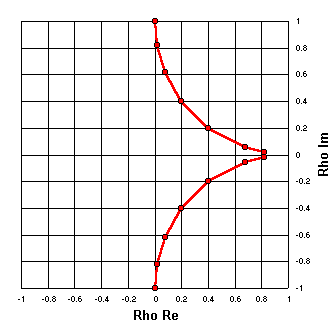
X = ±10
You get the idea, so now let's show two sets of plots.
The top arc is for R = 0, 10, 25, 50, 100, 250, 500 with X = 10,
and the bottom arc is for the same set of R values but with X = -10.
|
|
|
X = ±50
One last time. Same set of R values as in the previous plot, with X = 50 and X = -50.
|
|
|

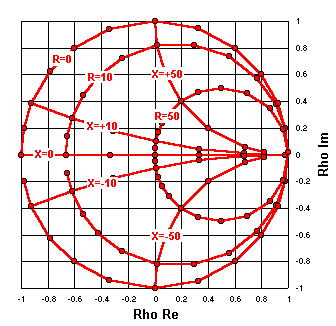
Here are the previous six plots superimposed,
with labels to indicate which component of the arbitrary Z values was held constant.
|
|
|
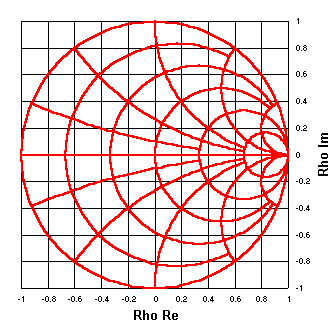
Now we've added a few more points to each of the previous plots and removed the individual point markers
in order to smooth the curves.
We've also added plots for R held constant at 25, 100, and 250 ohms with X varying,
and for X held constant at ±25, ±100, and ±250 ohms with R varying.
|
|
|
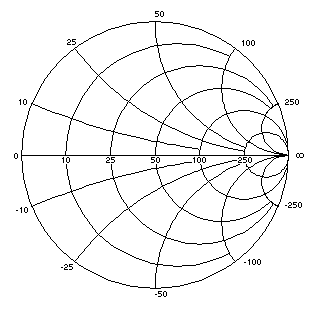
Now the Rho Re and Rho Im
grid lines and labels have been hidden.
The heavy red plot lines have been changed to light black "grid" lines and
labels have been added to show the constant R or X values which were used to create each line.
Note that this chart, just like the SWR meter, is still based on reflection coefficients. But now instead of
the chart scales showing rho magnitude and angle, or rho real and imaginary components,
they show impedance (R and X) values for a 50 ohm reference base.
This is exactly like adding a third scale to the thermometer, perhaps degrees Kelvin, and then
erasing the Celsius and Fahrenheit scales. The instrument would still measure temperature and you would still
call it a "thermometer."
The chart at left could be called a "Reflection Coefficient Chart with Impedance Scale Markings,"
but most people choose to honor its inventor instead and call it a Smith Chart.
|
|
