 |
|
 |
| |
|
|

AutoEZ - Automated use of EZNEC

AutoEZ works in conjunction with the EZNEC antenna modeling program and allows you to use variables to control diverse aspects of the model. You can then run multiple EZNEC test cases while AutoEZ automatically changes one or more variables between runs. AutoEZ can take full advantage of all the features in EZNEC v. 5.0, v. 6.0, and v. 7.0 such as virtual wires, realistic transmission lines with loss, transformers,
L networks (which can be combined to form T and Pi networks), and parallel connected loads.
Looking for the SteppIR Yagi models? Click the icon or click here.
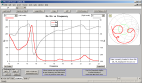
Zplots uses Excel's charting capabilities to plot impedance data obtained from a variety of sources, including the W5BIG AIM4170 Antenna Analyzer, the N2PK Vector Network Analyzer, and several different antenna modeling programs.
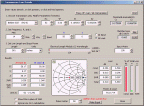
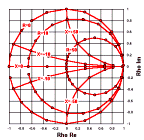
Experiment with transmission lines. Watch impedance points change on a Smith chart as you quickly vary input parameters using spin buttons. Plot matched line loss versus frequency.
An Excel (XL) workbook to calculate antenna gain/temperature ratio (G/Ta), average gain, directivity, and other metrics by using 3D pattern data from EZNEC, AutoEZ, 4nec2, A.M., or MMANA-GAL.
Online coax loss calculators that use SWR as one of the inputs certainly are convenient but can you trust the results? Alternative tools which are much more accurate are readily available.
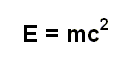
Two small workbooks showing various formulas that are used when dealing with transmission lines. Nothing to do with Albert Einstein, really.
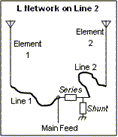
An Excel workbook to aid in the design of a feed system for a typical two-element phased array.
Two workbooks that provide a remote control link between Zplots and the W5BIG AIM device or the DG8SAQ VNWA device, respectively. Neither will mute annoying TV commercials.
L. B. Cebik, W4RNL, developed an algorithm for calculating the dimensions of a Moxon Rectangle antenna. He asked me to write this small program incorporating his work and I was happy to oblige.
Have you ever wondered what these four things have in common? No, of course not, me neither! But perhaps you have wondered why a Smith chart has such strange grid lines. Believe it or not, there is a logical progression from Speedometers to Smith charts that will make the Smith grid crystal clear.
Concerned or confused about downloading an Excel workbook that may contain a virus? This brief explanation might help.
Make a GIF, JPEG, or PNG file from any picture or bitmap copied to the clipboard, with optional resizing. This utility requires Excel 97 or later but the clipboard copy can be made with Excel, Word, or any other program that can copy a bitmap or metafile to the clipboard.
Thanks for Visiting!
73, Dan
![]()
![]()
![]() Contents of this web site copyright © Dan Maguire 2001-2019. All rights reserved.
Contents of this web site copyright © Dan Maguire 2001-2019. All rights reserved.